K8s Log Monitoring with Loki + Grafana
Introduction
In Part 2, we built a GitOps pipeline with ArgoCD. A single Git push now triggers an automatic deployment.
But there is one piece still missing. How do you know whether the deployed app is actually working?
Running kubectl logs one pod at a time has its limits.
With multiple Pods, you have to check each one individually.
When a Pod restarts, its previous logs are gone.
If someone says “I think there was an error around 3 AM last night,” kubectl logs is not going to help.
What you need is a structured log monitoring setup — one that collects logs in a single place, lets you search by time range, and filter by keyword.
This post installs the Loki + Promtail + Grafana stack to build a log monitoring environment for a kind cluster.
This is the third and final post in the Local K8s Practice series.
- Part 1: Setting Up a Local K8s Cluster with kind
- Part 2: Building a Local GitOps Pipeline with ArgoCD on kind
- This post: K8s Log Monitoring with Loki + Grafana
The Loki + Promtail + Grafana Stack
There are two popular approaches to collecting and querying logs in a K8s environment:
| Stack | Components | Characteristics |
|---|---|---|
| ELK | Elasticsearch + Logstash + Kibana | Powerful but heavy. Elasticsearch is memory-hungry |
| PLG | Promtail + Loki + Grafana | Lightweight and K8s-native. Label-based design like Prometheus |
For local practice, the PLG stack is the obvious choice. It uses fewer resources while still covering everything you need.
Here is what each component does:
Loki — Log Storage
Loki is a log aggregation system built by Grafana Labs. Its tagline — “Like Prometheus, but for logs” — captures the core idea well.
Just as Prometheus indexes metrics by labels, Loki indexes logs by labels (namespace, pod, container, etc.). It does not index the log content itself. This is the biggest difference from Elasticsearch.
Elasticsearch indexes log content for full-text search, which means the index can grow even larger than the log data itself. Loki only indexes labels and stores log content as-is, so the index stays small and resource usage stays low.
There is a trade-off. Grep-style searches on log content are slower than in Elasticsearch. But most of the time, “show me recent logs for this Pod” or “find error logs in this time window” is all you need, and Loki handles those queries fast enough.
Promtail — Log Collector
Promtail reads Pod logs from each node and ships them to Loki. In K8s, it runs as a DaemonSet.
A DaemonSet deploys exactly one Pod per node.
If you have 2 worker nodes, 2 Promtail Pods will be running.
Each Promtail reads log files from its own node (/var/log/pods/) and sends them to Loki.
Labels that Promtail attaches automatically:
| Label | Description |
|---|---|
__meta_kubernetes_pod_name | Pod name |
__meta_kubernetes_namespace | Namespace |
__meta_kubernetes_pod_label_app | Pod’s app label value |
__meta_kubernetes_container_name | Container name |
These labels enable filtering in Grafana like “namespace=default, app=marketplace.”
Grafana — Visualization
Grafana is a dashboarding tool that visualizes data from various sources. Add Loki as a data source to search and query logs. Add Prometheus to view metric graphs.
In this guide, we use the Grafana instance included in kube-prometheus-stack. This way, both Prometheus (metrics) and Loki (logs) are accessible from a single Grafana.
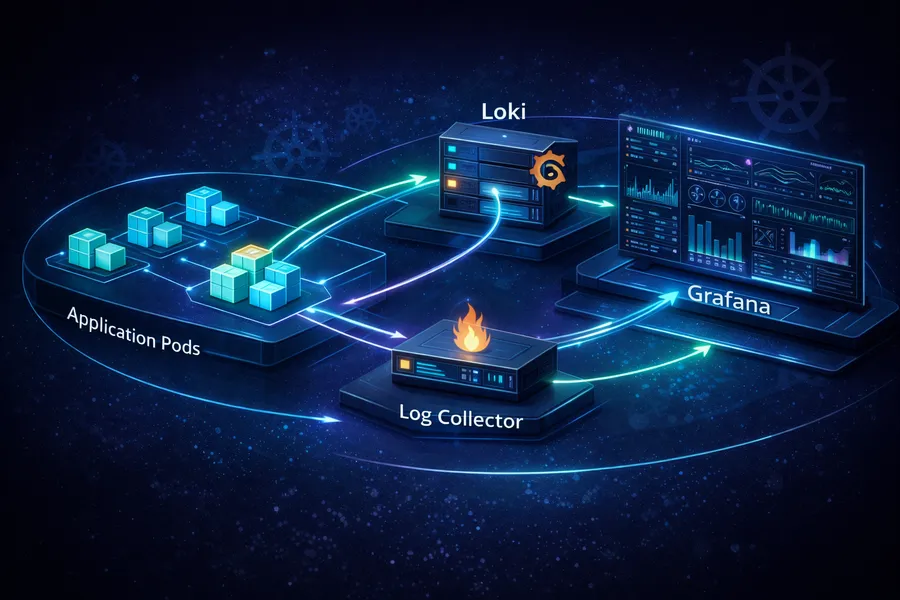
Overall Architecture
Here is how logs flow through the system:
Pod (log output)
  |
/var/log/pods/ (log files on the node)
  |
Promtail (DaemonSet, one per node)
  | HTTP push
Loki (log storage)
  | LogQL query
Grafana (visualization/search)
When a Pod writes to stdout/stderr, the logs are saved as files in the node’s /var/log/pods/ directory.
Promtail tails these files and sends new log entries to Loki.
When you run a LogQL query in Grafana, Loki searches its stored logs and returns the results.
Creating the monitoring Namespace
All monitoring-related resources go into the monitoring namespace.
Separating apps from monitoring resources makes management easier.
kubectl create namespace monitoringnamespace/monitoring createdNamespace separation is not just for organization.
When you apply RBAC (Role-Based Access Control), you can assign permissions at the namespace level.
In production, you might give developers read-only access to default
while restricting monitoring to the operations team.
Installing kube-prometheus-stack
The first component in our monitoring setup is kube-prometheus-stack. This single Helm chart installs Prometheus, Grafana, AlertManager, and a variety of K8s metric collectors all at once.
You might wonder: “This is a Loki post — why install Prometheus first?” The reason is simple. We will use the Grafana instance bundled with kube-prometheus-stack, and if you ever want to extend into metric monitoring, Prometheus needs to be in place anyway. Installing everything together from the start is more efficient.
Adding the Helm Chart
helm repo add prometheus-community https://prometheus-community.github.io/helm-charts
helm repo update
Writing prometheus-values.yaml
Create a custom values file before installing:
grafana:
  adminPassword: admin
  service:
    type: NodePort
  additionalDataSources:
    - name: Loki
      type: loki
      url: http://loki.monitoring:3100
      access: proxy
      isDefault: false
prometheus:
  prometheusSpec:
    serviceMonitorSelectorNilUsesHelmValues: false
    podMonitorSelectorNilUsesHelmValues: false
Here is what each setting does:
grafana section
| Setting | Description |
|---|---|
adminPassword: admin | Grafana admin password. Kept simple for local practice |
service.type: NodePort | Expose Grafana via NodePort for external access |
additionalDataSources | List of data sources to add to Grafana |
additionalDataSources is the key setting here.
We register the Loki data source even though Loki is not installed yet.
Grafana reads this configuration on startup and adds the data source automatically.
Once Loki is installed later, it connects immediately via http://loki.monitoring:3100.
This works because K8s Service names are automatically registered as DNS entries.
loki.monitoring means “the Service named loki in the monitoring namespace.”
prometheus section
| Setting | Description |
|---|---|
serviceMonitorSelectorNilUsesHelmValues: false | Collect ServiceMonitors from all namespaces |
podMonitorSelectorNilUsesHelmValues: false | Collect PodMonitors from all namespaces |
If these two settings are not false, Prometheus only scrapes ServiceMonitors from the same Helm release.
Setting them to false allows Prometheus to pick up metrics from apps like marketplace in other namespaces.
Running the Installation
helm install prometheus prometheus-community/kube-prometheus-stack \
  -n monitoring \
  -f prometheus-values.yaml
Installation takes about 1-2 minutes. Once complete, check the Pod status:
kubectl get pods -n monitoringNAME READY STATUS RESTARTS AGE
alertmanager-prometheus-kube-prometheus-alertmanager-0 2/2 Running 0 60s
prometheus-grafana-xxxxxxxxxx-xxxxx 3/3 Running 0 60s
prometheus-kube-prometheus-operator-xxxxxxxxxx-xxxxx 1/1 Running 0 60s
prometheus-kube-state-metrics-xxxxxxxxxx-xxxxx 1/1 Running 0 60s
prometheus-prometheus-kube-prometheus-prometheus-0 2/2 Running 0 60s
prometheus-prometheus-node-exporter-xxxxx 1/1 Running 0 60sThat is quite a few Pods. Here is what each one does:
| Component | Role |
|---|---|
| grafana | Visualization dashboard. Query logs and metrics here |
| prometheus | Metric collection and storage. A time-series database |
| alertmanager | Alert management. Sends notifications via Slack/email when conditions are met |
| kube-prometheus-operator | Operator that manages Prometheus CRDs (ServiceMonitor, etc.) |
| kube-state-metrics | Converts K8s object states (Deployment, Pod, etc.) into metrics |
| node-exporter | Collects hardware metrics like CPU, memory, and disk from each node |
Tip:
node-exporteris also a DaemonSet. If you have 2 nodes, there will be 2 node-exporter Pods. Each one collects hardware resource usage from its own node.
Installing the Loki Stack
Now install the core log collection components: Loki and Promtail. Grafana’s loki-stack chart installs both Loki and Promtail in one step.
Adding the Helm Chart
helm repo add grafana https://grafana.github.io/helm-charts
helm repo update
Writing loki-values.yaml
promtail:
  enabled: true
grafana:
  enabled: false      # Using the Grafana from kube-prometheus-stack instead
  sidecar:
    datasources:
      enabled: false   # Disable automatic datasource registration
loki:
  persistence:
    enabled: false     # No persistent storage needed for local practice
  isDefault: false
What each setting means:
| Setting | Value | Reason |
|---|---|---|
promtail.enabled | true | Install Promtail alongside Loki. Required for log collection |
grafana.enabled | false | Grafana is already installed via kube-prometheus-stack. Installing it again would create two Grafana instances |
grafana.sidecar.datasources.enabled | false | Prevent loki-stack from trying to register its own Grafana datasource |
loki.persistence.enabled | false | Local practice — it is fine if log data is lost when the Pod restarts |
loki.isDefault | false | Do not set Loki as Grafana’s default data source |
grafana.enabled: false is the most important setting.
If you leave it as true, loki-stack installs its own Grafana,
which conflicts with the one from kube-prometheus-stack.
Having two Grafana instances in the same namespace creates confusion.
Running the Installation
helm install loki grafana/loki-stack \
  -n monitoring \
  -f loki-values.yaml
Verify after installation:
kubectl get pods -n monitoring -l app=lokiNAME READY STATUS RESTARTS AGE
loki-0 1/1 Running 0 30skubectl get pods -n monitoring -l app=promtailNAME READY STATUS RESTARTS AGE
loki-promtail-xxxxx 1/1 Running 0 30s
loki-promtail-yyyyy 1/1 Running 0 30sLoki runs as a StatefulSet (1 Pod), and Promtail runs as a DaemonSet (one Pod per node). Since the kind cluster has 2 worker nodes, you should see 2 Promtail Pods.
Note: If Promtail is in
CrashLoopBackOff, the issue is often related to the/var/log/podsmount. Check the error message withkubectl logs <promtail-pod> -n monitoring.
Troubleshooting: Loki Data Source Conflicts
There is a common issue that comes up during initial setup. Loki does not appear as a data source in Grafana, or it shows up twice.
The Problem
When you install loki-stack with default settings, this happens:
- loki-stack tries to register the Loki datasource via its own Grafana sidecar
- kube-prometheus-stack’s Grafana already has Loki registered via
additionalDataSources - The two configurations conflict, resulting in duplicate datasources or none at all
Root Cause
The loki-stack chart defaults to grafana.sidecar.datasources.enabled: true.
With this setting on, loki-stack creates a ConfigMap
that the Grafana sidecar container detects and uses to auto-register the datasource.
The problem is that this ConfigMap targets kube-prometheus-stack’s Grafana,
since that Grafana also has a sidecar.
The result is that additionalDataSources and sidecar auto-registration both fire at the same time, causing a conflict.
Solution
The fix is to clearly separate responsibilities:
- Loki datasource registration: Handled by kube-prometheus-stack’s
additionalDataSources - loki-stack: Only installs Loki and Promtail. Does not touch datasource registration
These two lines in loki-values.yaml implement this separation:
grafana:
  enabled: false
  sidecar:
    datasources:
      enabled: false
grafana.enabled: false alone is not enough.
Even without installing Grafana, the sidecar datasource ConfigMap can still be created.
You need to explicitly set sidecar.datasources.enabled: false for a clean setup.
Lesson: When combining multiple Helm charts, clearly define which chart owns which responsibility. When charts try to auto-configure overlapping features, you get hard-to-debug problems. If you suspect a conflict, check each chart’s default values:
helm show values grafana/loki-stack | grep -A 5 sidecar
Accessing Grafana and Viewing Logs
Everything is installed. Now access Grafana and view actual logs.
Port Forwarding to Grafana
kubectl port-forward svc/prometheus-grafana -n monitoring 3000:80The Service name is prometheus-grafana because
the kube-prometheus-stack Helm release name (prometheus) is prepended as a prefix.
Logging In
Open http://localhost:3000 in your browser.
- Username:
admin - Password:
admin
The initial password is admin because we set grafana.adminPassword: admin in prometheus-values.yaml.
Verifying the Loki Data Source
After logging in, go to Connections > Data sources in the left sidebar. The data source list should include:
| Data Source | Type | URL |
|---|---|---|
| Prometheus | prometheus | http://localhost:9090 |
| Loki | loki | http://loki.monitoring:3100 |
If Loki is in the list, everything is working. If not, refer to the troubleshooting section above.
Querying Logs — Explore
Let us query some actual logs.
- Click the Explore icon (compass shape) in the left sidebar
- Select Loki from the data source dropdown at the top
- In Label filters, select:
namespace=defaultapp=marketplace
- Click Run query
The marketplace Pod’s logs will appear in chronological order. You should see Spring Boot startup logs, HTTP request logs, and so on.
LogQL Basics
Instead of using label filters, you can write LogQL queries directly. LogQL is Loki’s query language, with syntax similar to PromQL (Prometheus Query Language).
Commonly used queries:
# Logs for a specific Pod
{namespace="default", app="marketplace"}

# Filter for error logs only
{namespace="default", app="marketplace"} |= "ERROR"

# Exclude a specific string
{namespace="default", app="marketplace"} != "health"

# Filter with regex
{namespace="default", app="marketplace"} |~ "Exception|Error"

# Pipeline: parse JSON and filter by field
{namespace="default", app="marketplace"} | json | level="error"| Operator | Meaning |
|---|---|
|= | Contains string |
!= | Does not contain string |
|~ | Regex match |
!~ | Regex no match |
The label selector inside {} selects the log stream,
and | pipe operators chain filtering and parsing operations.
Live Tail
Click the Live button in Grafana Explore to switch to real-time log streaming mode. New logs appear on screen as soon as they are generated.
{namespace="default", app="marketplace"} |= "ERROR"With this error-only filter active in Live mode,
you see errors the instant they occur.
Far more convenient than opening multiple terminals and running kubectl logs -f for each Pod.
Tip: Live mode only works while the browser tab is open. For background alerting, use AlertManager instead. But for local practice, Live mode is more than sufficient.
ServiceMonitor Setup (Bonus)
With log monitoring in place, let us add metric monitoring as a bonus. Since Prometheus was installed alongside kube-prometheus-stack, adding a ServiceMonitor is all it takes to start collecting app metrics.
Spring Boot Actuator
For metrics to be collected, the app must expose them. Spring Boot can expose Prometheus-format metrics via Actuator + Micrometer.
Add these dependencies to build.gradle:
implementation 'org.springframework.boot:spring-boot-starter-actuator'
runtimeOnly 'io.micrometer:micrometer-registry-prometheus'
Enable the Prometheus endpoint in application.yml:
management:
  endpoints:
    web:
      exposure:
        include: health, prometheus
  metrics:
    tags:
      application: marketplace
This creates the /actuator/prometheus endpoint.
Accessing this endpoint returns JVM memory usage, HTTP request counts, response times, and other metrics
in Prometheus text format.
Writing marketplace-servicemonitor.yaml
Create a ServiceMonitor so Prometheus scrapes the marketplace app’s metrics:
apiVersion: monitoring.coreos.com/v1
kind: ServiceMonitor
metadata:
  name: marketplace
  namespace: monitoring
  labels:
    release: prometheus
spec:
  namespaceSelector:
    matchNames:
      - default
  selector:
    matchLabels:
      app: marketplace
  endpoints:
    - port: http
      path: /actuator/prometheus
      interval: 15s
What each field means:
| Field | Description |
|---|---|
metadata.labels.release: prometheus | Required for kube-prometheus-stack to recognize this ServiceMonitor. Must match the Helm release name |
namespaceSelector.matchNames | Namespace where the target Service lives |
selector.matchLabels | Labels of the target Service. The marketplace Service must have an app: marketplace label |
endpoints[].port | Port name defined in the Service. The marketplace Service’s port name must be http |
endpoints[].path | Path to scrape metrics from |
endpoints[].interval | Scrape interval. Collects metrics every 15 seconds |
If the release: prometheus label is missing, Prometheus will ignore this ServiceMonitor.
This catches many people off guard.
Even though serviceMonitorSelectorNilUsesHelmValues: false is set in prometheus-values.yaml
to collect ServiceMonitors from all namespaces,
the release label may still be part of the matching criteria. It is safer to include it explicitly.
Applying the ServiceMonitor
kubectl apply -f marketplace-servicemonitor.yamlservicemonitor.monitoring.coreos.com/marketplace createdAfter applying, verify that Prometheus recognizes the marketplace target:
kubectl port-forward svc/prometheus-kube-prometheus-prometheus -n monitoring 9090:9090Open http://localhost:9090/targets in your browser.
You should see monitoring/marketplace/0 with a status of UP.
Viewing Metrics in Grafana
Go back to Grafana and switch the data source to Prometheus in Explore. Use this PromQL query to check JVM memory usage:
jvm_memory_used_bytes{application="marketplace"}HTTP request count:
http_server_requests_seconds_count{application="marketplace"}With this setup, you can query both logs (Loki) and metrics (Prometheus) from a single Grafana instance. When something goes wrong, find the anomaly in metric graphs first, then check the logs from the same time window in Loki. This workflow significantly speeds up debugging.
Summary
Over three posts, we built a complete local K8s DevOps pipeline: cluster setup, automated deployment, and log monitoring.
Full Series Architecture
+-----------------------------------------------------+
|                  kind Cluster                        |
|                                                     |
|  +------------+   +-----------+   +---------------+ |
|  | Marketplace|   |  ArgoCD   |   |  monitoring   | |
|  |  (default) |   | (argocd)  |   |  namespace    | |
|  |            |   |           |   |               | |
|  |  Pod x2    |   |  Server   |   |  Prometheus   | |
|  |  Service   |   |  Repo Svr |   |  Grafana      | |
|  |  Ingress   |   |           |   |  Loki         | |
|  |            |   |           |   |  Promtail x2  | |
|  +------------+   +-----------+   +---------------+ |
|       ^               ^               ^             |
|       |          Git watch/sync    Log/metric        |
|       |                            collection        |
+-------+---------------+---------------+-------------+
        |               |               |
   marketplace.local   GitHub       Grafana UI
   (browser access)  (marketplace-  (localhost:3000)
                     deploy repo)
Here is what each post covered:
| Part | Component | Role |
|---|---|---|
| Part 1 | kind cluster | Local multi-node K8s environment |
| Part 1 | Nginx Ingress | External traffic routing |
| Part 1 | marketplace app | Spring Boot app with manual deployment |
| Part 2 | ArgoCD | GitOps-based automated deployment |
| Part 2 | marketplace-deploy | Declarative deployment management via Helm chart |
| Part 3 | kube-prometheus-stack | Prometheus + Grafana + AlertManager |
| Part 3 | Loki + Promtail | Log collection and storage |
| Part 3 | ServiceMonitor | App metric collection |
Local vs. Production Differences
The environment built in this series is for local practice, but the overall architecture is the same in production (EKS, GKE, etc.).
| Aspect | Local (kind) | Production (EKS) |
|---|---|---|
| Cluster | kind (Docker-based) | EKS (AWS managed) |
| Image registry | kind load (local load) | ECR, Docker Hub |
| CI | Manual (docker build) | GitHub Actions, Jenkins |
| CD | ArgoCD | ArgoCD (same) |
| Log storage | Loki (in-memory, non-persistent) | Loki + S3 backend (persistent) |
| Metric storage | Prometheus (local) | Prometheus + Thanos or AWS Managed Prometheus |
| Access method | port-forward | ALB + Route53 |
The key takeaway: the tools and patterns are the same. ArgoCD, Loki, Prometheus, Grafana — the tools you practiced locally are the same ones used in production. What changes are the storage backend (S3), network configuration (ALB), and CI automation.
By understanding the full architecture through local practice, you develop an intuition: “I have done this before.” That intuition makes adapting to new tools and environments significantly faster.